Current Blocksize, by graphs.
I used bitcoin-iterate and gnumeric to render the current bitcoin blocksizes, and here are the results.
My First Graph: A Moment of Panic
This is block sizes up to yesterday; I've asked gnumeric to derive an exponential trend line from the data (in black; the red one is linear)
[caption id="" align="aligncenter" width="748"]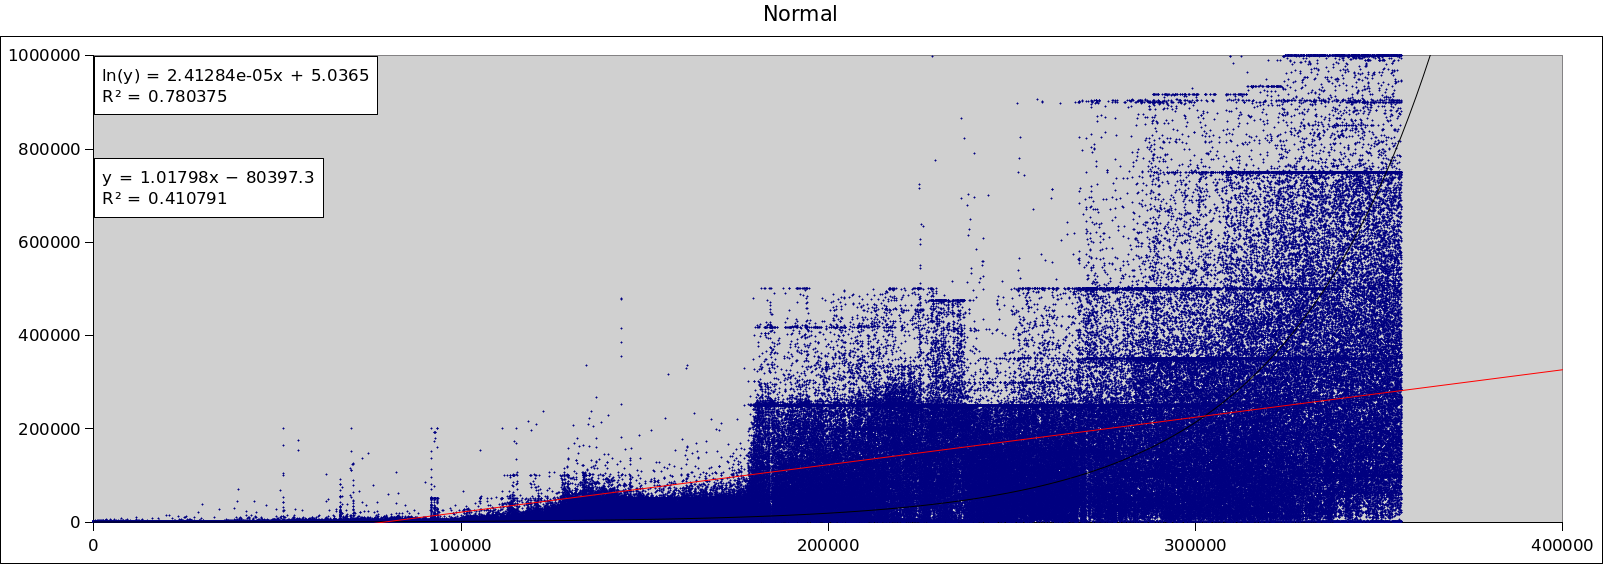 Woah! We hit 1M blocks in a month! PAAAANIC![/caption]
That trend line hits 1000000 at block 363845.5, which we'd expect in about 32 days time! This is what is freaking out so many denizens of the Bitcoin Subreddit. I also just saw a similar inaccurate [correction: misleading] graph reshared by Mike Hearn on G+ :(
But Wait A Minute
That trend line says we're on 800k blocks today, and we're clearly not. Let's add a 6 hour moving average:
[caption id="" align="aligncenter" width="750"]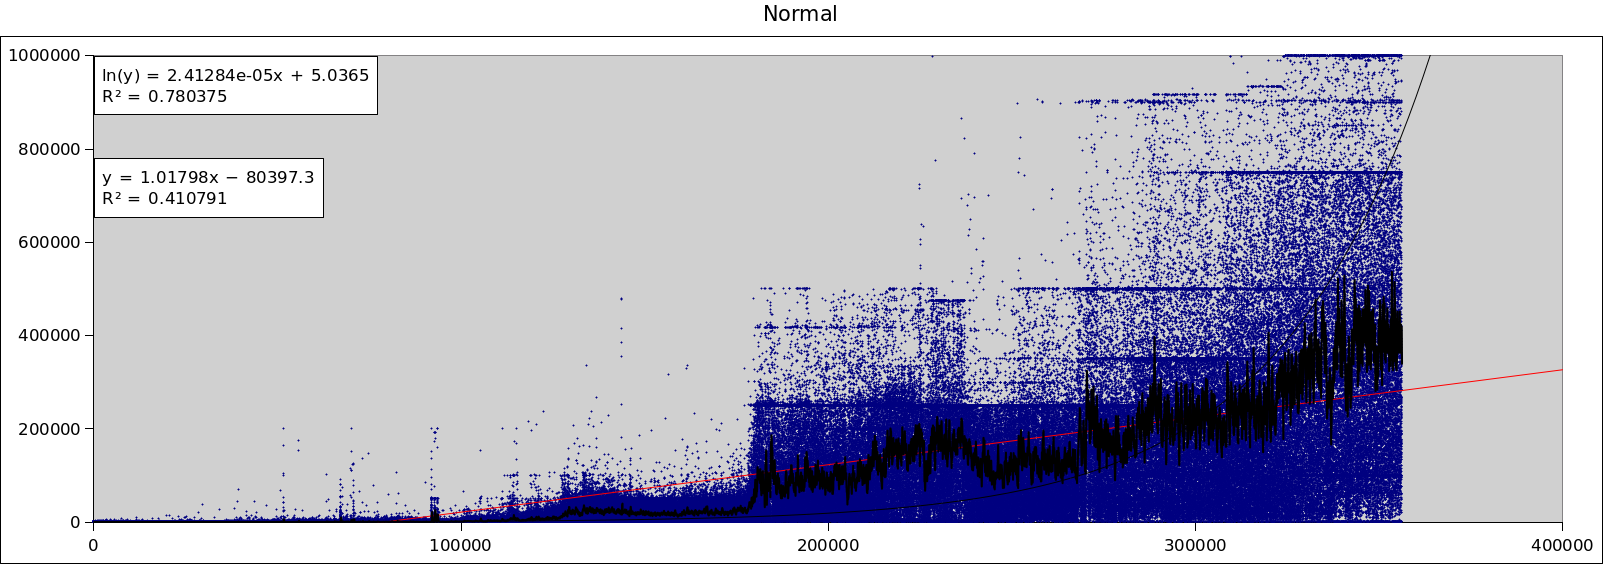 Oh, we're only halfway there....[/caption]
In fact, if we cluster into 36 blocks (ie. 6 hours worth), we can see how misleading the terrible exponential fit is:
[caption id="" align="alignnone" width="748"]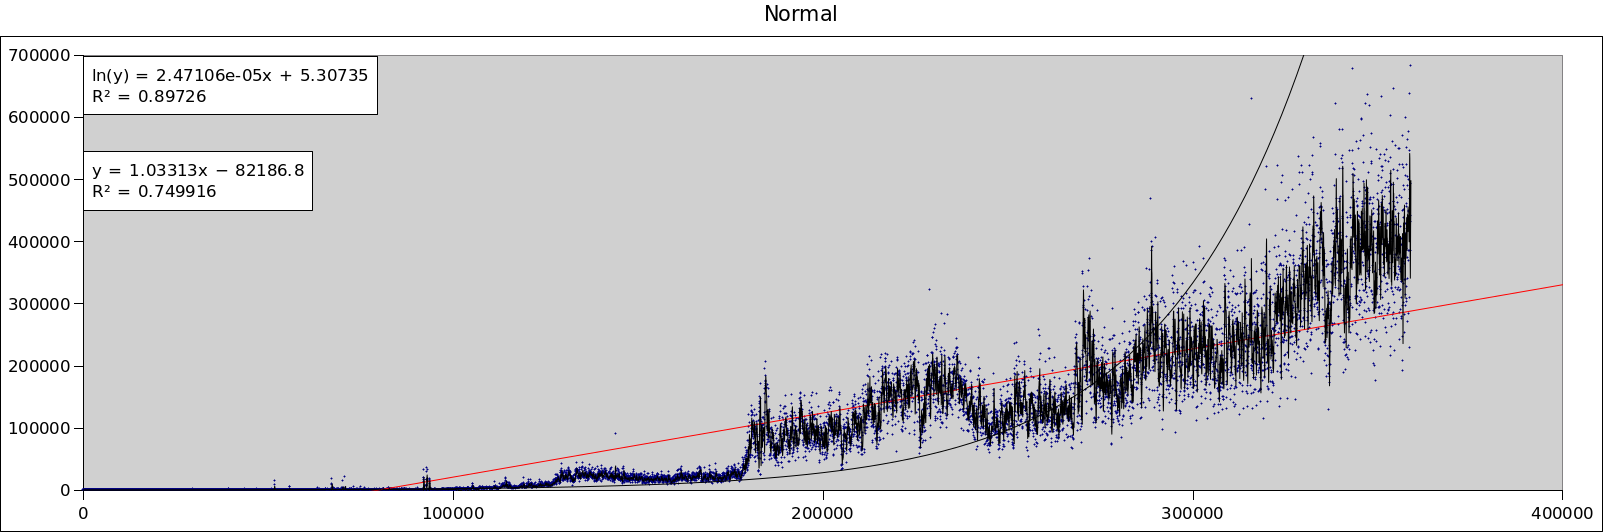 What! We're already over 1M blocks?? Maths, you lied to me![/caption]
Clearer Graphs: 1 week Moving Average
[caption id="" align="aligncenter" width="750"] Actual Weekly Running Average Blocksize[/caption]
So, not time to panic just yet, though we're clearly growing, and in unpredictable bursts.